The Quality of Health and Education Systems Across Africa: Evidence from a Decade of Service Delivery Indicators Surveys
A commentary on the education systems across Africa
Praxis Now is a student research group which was established and is supervised by John Marangos. In this article, Ioanna Litsiou is a co-author
This is a review of education services in nine African countries from the World Bank article, “The Quality of Health and Education Systems Across Africa”. Chapter 3 of the publication, “Providing educational services in 9 African countries”, which is the subject of this article, contains a decade’s worth of data from nine African countries: Kenya, Madagascar, Morocco, Mozambique, Niger, Nigeria, Tanzania, Togo, and Uganda.
The majority of education systems in these nine countries already faced difficulties before the pandemic. The Covid-19 pandemic was merely an addition to the educational crisis. According to the World Bank (2019), 53% of 10-year-olds in these countries were incapable of reading or understanding a simple text, a status called learning poverty (Gatti et al., 2021). Unprepared students, teachers with deficient skills and lack of inspiration, meager or insufficient school inputs, and poor school management combined with poor governance were the principal causes of learning poverty. The cause of this was the provision of poor-quality amenities. The pandemic has highlighted the problem of learning poverty and has made it more acute. At the height of the 2020 pandemic, 1.6 billion children worldwide did not go to school physically (UN, 2020). Due to the incapability to access digital equipment and the internet, many children from low-income households have been forced to drop out of school, either permanently or temporarily.
Table 1 is an annotation of Educational Service Index (SDI) research. These indicators measure the learning of fourth graders by recording the critical features of a typical student’s school experience and the opportunities for a successful education.
Table 1 Size of the SDI educational sample in nine African Countries, by country
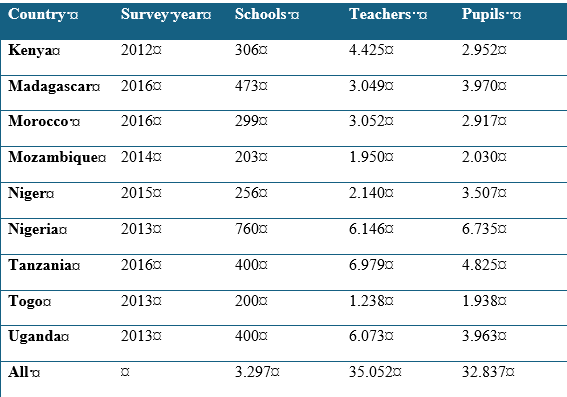
As shown in Table 1, all nine aforementioned countries participated in the research. More specifically, 3,297 schools have participated, which consist of almost 35,000 teachers and more than 32,000 students. All nine countries together account for almost 39% of students in Sub-Saharan Africa (Gatti et al., 2021). The survey data are part of each nation’s school censuses or government-compiled lists. The sample consists mainly of rural and public schools. 70% of schools in these countries are public. In general, there are few private schools in these countries.
One question that concerns authors is how much an average student learns. To answer this question, it is important to focus on the school itself and its organization. A typical primary school runs from first to sixth grade and usually has nine classrooms. On average, a total of 390 children, both boys and girls, attend the school. Each classroom has 47 students. Each school has 9 teachers, which means that the ratio between the 9 teachers and the children is on average 36 students per teacher (Gatti et al., 2021).
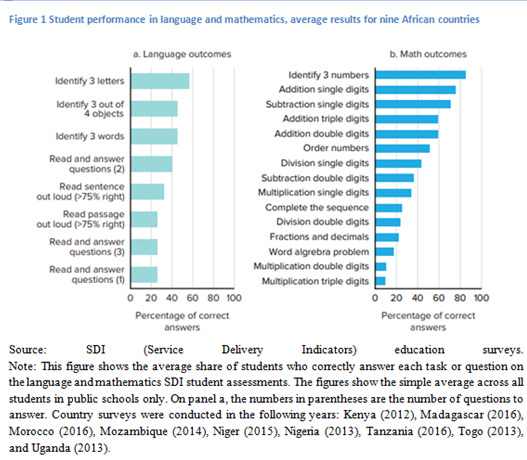
Generally, students show deficient levels of learning in all nine SDI countries. According to the literature, both verbal skills and skills relating to mathematics are major for academic life as well as the the labor market students will eventually join. The ability of students to read and solve simple fourth-grade math is essential. However, as shown in Figure 1, less than half of the children are qualified to read a sentence out loud and accurately, while around less than 40% are capable of correctly multiplication by one digit.
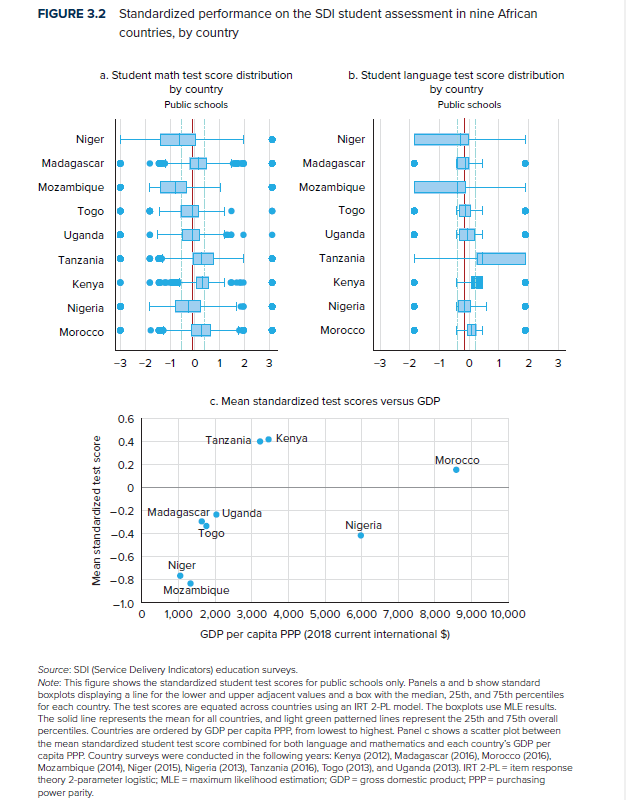
Due to the fact that there are inadequate levels of learning, it is of great importance to mention the dissimilarities in student achievements both within a country and between countries. In Niger, the gap between the highest and the lowest students’ accomplishments is remarkable. Regarding the differences between the countries, they are enormous and of major significance. The nine countries are classified as follows:
- Kenya, Madagascar, Morocco, and Tanzania
- Nigeria, Togo and Uganda and
- Mozambique, Niger
Tanzania is the country with the highest SDI achievement while Mozambique is the one with the lowest in terms of standard deviation.. This is easily understood from the following figure.
In the learning process, internal and external factors of the educational systems represent an essential role so that students are capable of the learning fundamental dexterities that will be beneficial to them throughout their lives. One of these factors is not only the presence of teachers, but how equipped those teachers are with the skills and abilities they need. If their presence increases, then it is likely that students’ learning will also improve, considering that teacher absence is associated with lower learning (Duflo, Hanna and Ryan, 2012). Teachers while at school many times instead of being in the classroom teaching choose to spend time on other activities. According to the authors, 22% of teachers were absent from the school during a surprise visit, while if those who are absent from the classroom are counted, the absence rate increases by 16 points, to 38%. The paucity of observation and accountability in senior executives combined with the lack of motivation are the fundamental grounds for the absence of teachers (Miti 2016, Muradidharan et al, 2016).
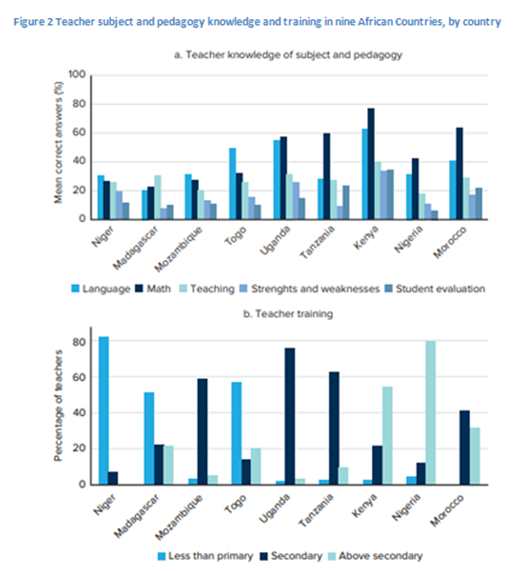
Figure 2 demonstrates teacher subject and pedagogy knowledge and training in the nine African countries, by country. As can be seen from Panel a in the chart, Kenya is the country with the highest average score in terms of teacher knowledge while Nigeria has the lowest score . Although in Nigeria there is a lower percentage of knowledge, there is a higher percentage of teachers who have completed secondary education, not only in relation to Kenya but in comparison with the whole sample, as shown in Panel b of the chart .
The learning process of students is also influenced by the inputs to school units. The basic inputs are functional rooms with blackboards placed in such a way that all students can see and read from the blackboard. There should be small classrooms as learning has proven ineffective in large classrooms (Ganimian and Murnane, 2016). In addition, an important input is the existence of a restroom, which should be accessible, clean, and different for both sexes in each school unit (Adukia, 2017).
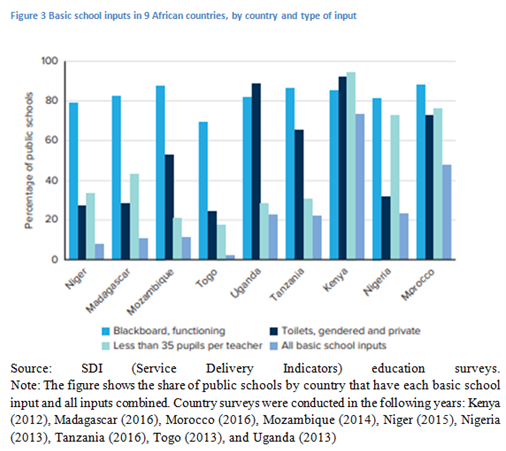
According to Figure 3, most schools have a blackboard. In four out of the nine countries (Niger, Madagascar, Togo, and Nigeria) a small percentage of schools are equipped with different bathrooms for the sexes. Three of the nine countries (Kenya, Nigeria and Morocco) have a high proportion of schools with one or more teachers for every 35 students. Togo is the country with the lowest percentage of the three inputs (4%), while Kenya is the country with the highest (70%). In six of the nine countries in the sample, the availability rate of all three inputs is approximately 20% or lower (Gatti et al., 2021). Τhe highest performance is recorded in urban schools and in several rural schools, while the lowest performance is observed only in rural schools. The best-performing schools have more and better-qualified teachers. Through the results of the SDI survey, it is possible to improve school units. More resources have been shown to contribute positively to student performance (Ganimian and Murnane, 2016). Disciplining more teachers also improves the learning process.
Finally, what has been mentioned so far concerns exclusively public education in these nine African countries. However, if private education is also studied, additional knowledge about improving learning will become available. Indeed, solutions provided by private schools can be useful. To illustrate this point of view, the solutions proposed by Gatti, R., Andrews, K., Avitabile, C., Conner, R., Sharma, J., and Chang, A. (2021), can assist public education and make it more innovative. Furthermore, to improve the education provided, the authorities and experts are obligated to take action. Improvements can involve both the addition of equipment to schools as well as the addition of more qualified teaching staff to schools with a greater desire for work and learning.
References
Adukia, A. 2017. “Sanitation and Education.” American Economic Journal: Applied Economics 9 (2): 23–59.
Duflo, E., R. Hanna, and S. P. Ryan. 2012. “Incentives Work: Getting Teachers to Come to School.” American Economic Review 102 (4): 1241–78.
Ganimian, A. J., and R. J. Murnane. 2016. “Improving Education in Developing Countries: Lessons from Rigorous Impact Evaluations.” Review of Educational Research 86 (3): 719–55.
Gatti, R., Andrews, K., Avitabile, C., Conner, R., Sharma, J. and Chang, A. (2021), Evidence from a Decade of Service Delivery Indicators Surveys- The Quality of Health and Education Systems Across Africa. [online] Available at: https://openknowledge.worldbank.org/bitstream/handle/10986/36234/9781464816758.pdf?sequence=7&isAllowed=y
Mbiti, Isaac M. 2016. “The Need for Accountability in Education in Developing Countries.” Journal of Economic Perspectives 30 (3): 109–32. doi: 10.1257/jep.30.3.109.
Muralidharan, K., J. Das, A. Holla, and A. Mohpal. 2016. “The Fiscal Cost of Weak Governance: Evidence from Teacher Absence in India.” Policy Research Working Paper 7579, World Bank, Washington, DC.
UN (United Nations). 2011. Millennium Development Goals Report 2011. New York: United Nations, June 2011. https://www.refworld.org/docid/4e42118b2.html
UN (United Nations) General Assembly. 2015. “Transforming Our World: The 2030 Agenda for Sustainable Development.” A/RES/70/1, October 21, 2015. UN General Assembly, New York. https://www.refworld.org/docid/57b6e3e44.html
UN (United Nations). 2020. “Policy Brief: Education during COVID-19 and Beyond.” UN, New York, August 2020. https://unsdg.un.org/resources/policy-brief-education-during-covid-19-and-beyond
World Bank. 2019. “Ending Learning Poverty: What Will It Take?” World Bank, Washington, DC. https://openknowledge.worldbank.org/handle/10986/32553

Based on your interests, you may also wish to read:
- How Can Sub-Saharan African Countries Minimize the Impact of Coronavirus Pandemic on Economic Performance?
- The Socio-economic Impact of COVID-19 on the African Economy
- A Crucial Barrier to Covid-19 Response in Africa: Public Trust in Government Institutions
- Corruption in Africa – A Double Threat in the Fight Against COVID-19